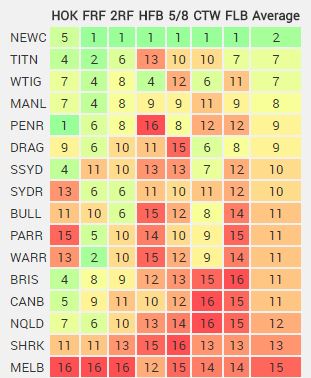
Yes you're correct, 1 is the best and 16 is the worst. The colours simply reflect the numbers, Green being good and Red bad. Some numbers don't appear as it's a weighted scale, generally because the Knights were so much easier to score on than everyone else. A simple example to explain:
Say you have 3 numbers and want to rank them largest to smallest, the numbers are 60, 20 & 10. On a normal scale 60=1st, 20=2nd & 10=3rd. Clearly this doesn't show the large difference between 1st & 2nd. A weighted scale takes this into account. I've used 16 buckets to divide the result into. In the example above 60=1st, 20=12th & 10=16th.
Notice in the 5/8 position the Knights are ranked 1 as the easiest team to score against, the next ranking is an 8 which shows just how many points the Knights gave up compared to the next worst team.
